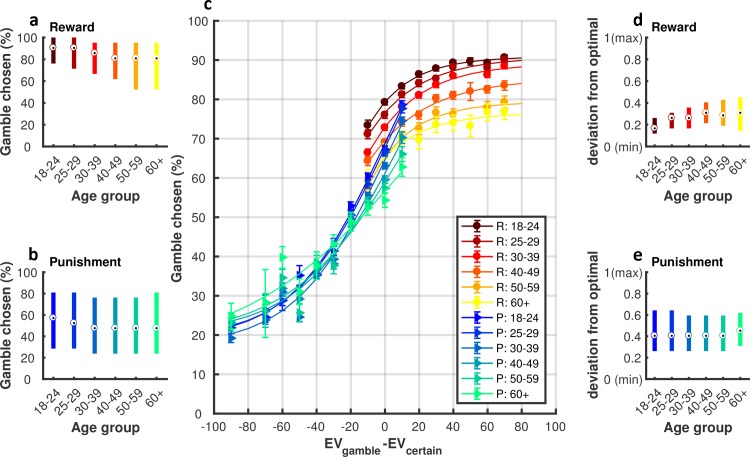
Fig 3. The proportion (%) of trials in which participants chose to gamble.
(a) Gamble rate in the reward and (b) punishment domain. The central mark in the boxplots indicates the median, and the bottom and top edges of the thick lines indicate the 25th and 75th percentiles, respectively; (c) Propensity to choose the gamble option as a function of EVgamble−EVcertain (data was grouped into bin sizes of 10). As indicated in the legend, each of the warm colours represents one age group in the reward (R) condition, and each of the cool colours represents one age group in the punishment (P) condition. The lines are fitted lines to y = a*exp(-b*x)+c; R2 = 0.979 ± 0.022; Error bars represent bootstrap 95% CIs; (d) Discrepancy between choice behaviour and optimal decisions in the reward domain. Specifically, we calculated whether the optimal decision on each trial was to gamble (1 if EVgamble-EVcertain>0) or skip (0, if EVgamble-EVcertain<0). We then subtracted this value from the observed behaviour of the participant (gamble = 1, skip = 0). If the average absolute difference between these values across trials was 0, then a participant was deemed as an optimal decision-maker; (e) Discrepancy between choice behaviour and optimal decisions in the punishment domain.

