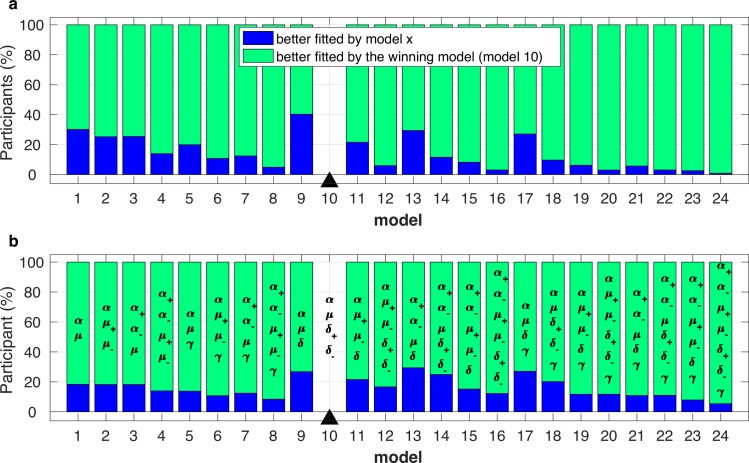
Fig 4. Subject-level AIC and BIC model comparison.
(a) For each participant, the winning approach avoidance model’s (model 10 [α, μ, δ+, δ−] as indicated by the black triangle; this model had the smallest summed BIC; S1 Table) BIC value was compared with the BIC value for each of the other models (x-axis). The percentage (%) of participants for which the winning model (smaller BIC value is preferred) better fitted their choice behaviour is shown in green (upper part of the bar). The percentage of participants for which the alternative model better fitted their choice behaviour is shown in blue (lower part of the bar). (b) Identical analysis for AIC. Parameter set for each model is also provided.

