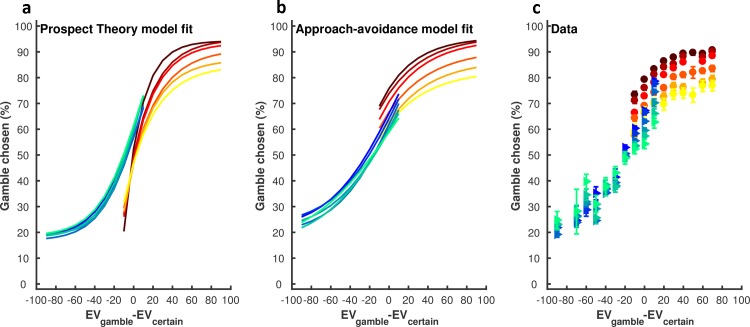
Fig 5. Average model fits across participants.
(a) Average model fit for the winning prospect theory model (ID = 4 in S1 Table [α+,α−,μ+,μ−]). The probability of choosing the gamble option (y-axis) predicted by the model (see Methods; Eq 2) is plotted against the difference in expected value between the two options (x-axis; EVgamble−EVcertain; grouped into bin sizes of 10). As indicated in the legend, each of the warm colours represents one age group in the reward (R) condition, and each of the cool colours represents one age group in the punishment (P) condition. The model cannot account for the observed differences across the life span, including (1) the gradual and monotonic decrease in gamble rate across the lifespan in the reward domain; (2) the changes in gamble propensity observed in the punishment domain across age groups (as the model fit shows almost no difference across the age groups in the punishment domain); (3) the higher gamble rate in the reward domain relative to the punishment domain when [EVgamble-EVcertain] is close to 0 (as the model fit shows the opposite) (model falsification [33]); (b) Average model fit across participants for the winning approach-avoidance model (ID = 10 in S1 Table, [α,μ, δ+,δ−]); (c) Data: propensity to choose the gamble option as a function of EVgamble−EVcertain.

