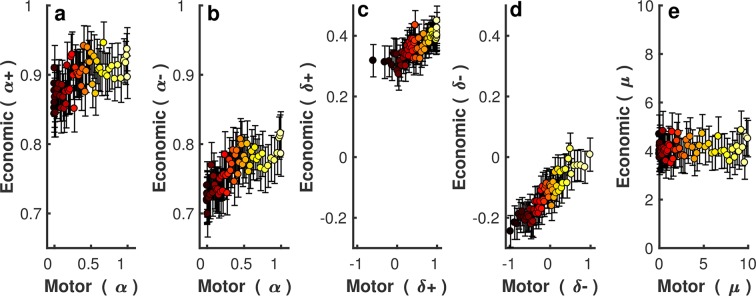
Fig 7. The relationship between approach-avoidance model parameters across the motor (x-axis) and economic (y-axis) gambling tasks.
(a-e) Each panel represents a single parameter; (a)The risk preference parameter in reward; and (b) punishment trials; (c) Pavlovian approach-avoidance parameter in reward; and (d) punishment trials; (e) the temperature parameter. The participants were binned into 60 groups (287 participants in each group) based on their motor parameter value. Within each panel, each dot represents the medians of motor parameters (x-axis) and economic parameter (y-axis) for each group. Error bars represent 95%CI in the economic decision-making task.

