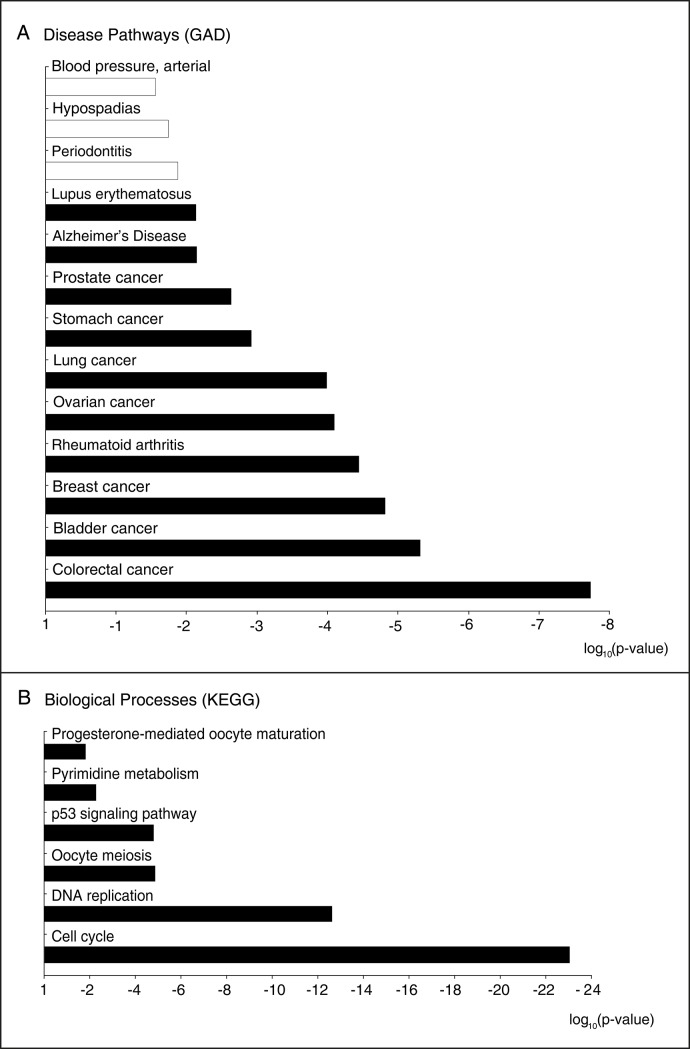
Fig 2. Gene set enrichment analysis of the core genes of cervical cancer.
(A) Significantly enriched disease pathways based on the gene-disease associations presented by the Genetic Association Database (GAD). (B) Significantly enriched biological processes based on the gene-process associations of the Kyoto Encyclopedia of Genes and Genome (KEGG) database. The white bar represents down-regulation of the pathway or process, whereas the black bars represents up-regulation.

