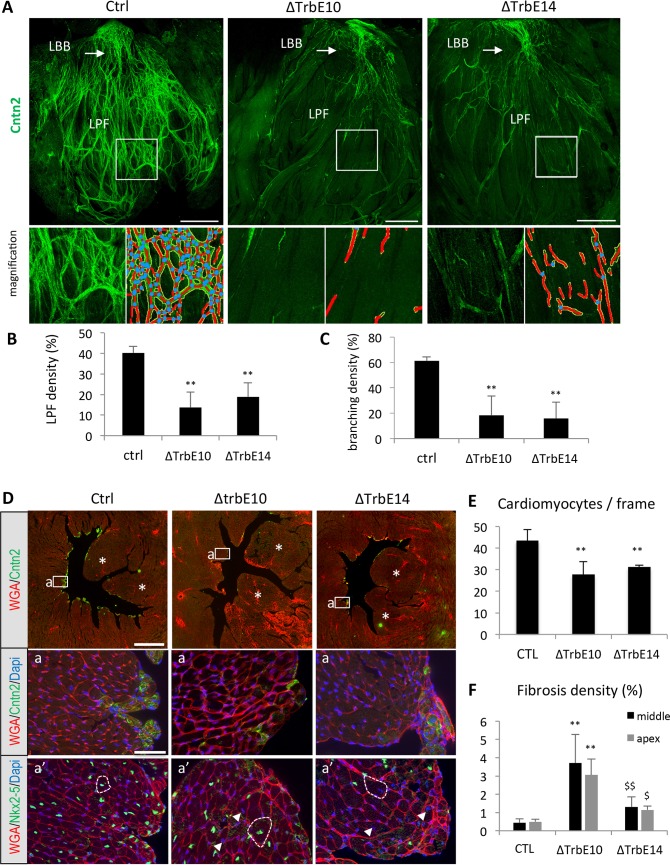
Fig 3. Ventricular conduction system defects, fibrosis and cardiac hypertrophy associated with Nkx2-5-induced hypertrabeculation.
(A) Whole-mount immunofluorescence with Contactin-2 on opened LV from control (Ctrl), Nkx2-5ΔTrbE10 (∆TrbE10) and Nkx2-5ΔTrbE14 (∆TrbE14) adult hearts. High magnifications of peripheral PFs are shown below beside the corresponding images treated with angiotool. Red lines indicate the PF, and blue dots the branch points. LBB: Left bundle branch; LFP: Left PFs. Scale bar = 1mm. (B-C) Quantification of PF (B) and branching density (C). (N = 3 hearts per group) Mean ± SD; **p<0.01 Nkx2-5ΔTrbE10 vs control, **p<0.01 Nkx2-5ΔTrbE14 vs control. (D) Immunofluorescence with Contactin-2 and WGA-cy3 antibodies on transversal sections at the mid-ventricular level from control (Ctrl), Nkx2-5ΔTrbE10 (∆TrbE10) and Nkx2-5ΔTrbE14 (∆TrbE14) adult hearts. Asterisks indicate papillary muscles. Scale bar = 1mm. (a-a’) High magnifications at the level of the interventricular septum (a) and a serial section stained with WGA-cy3 and Nkx2-5 (a’). Dotted lines indicate the size of cardiomyocytes and arrowheads Nkx2-5- nuclei present only in Nkx2-5ΔTrbE10 and Nkx2-5ΔTrbE14 mutants hearts. Scale bar = 50μm. (E) Quantification of cardiomyocytes hypertrophy by counting the number of cardiomyocytes per frame on high magnification images of transversal sections. (n = 20–30 frames per heart; N = 3 mice per group). **p<0.002 Nkx2-5ΔTrbE10 and Nkx2-5ΔTrbE14 vs control. (F) Fibrosis was quantified by measuring the percentage of WGA positive area in the LV. These measures were performed for 3 sections of adult hearts at the level of the apex and at mid-ventricle from control (N = 3), Nkx2-5ΔTrbE10 (**p < 0,005 (apex) and **p< 0,002 (mid) vs control, N = 3) and Nkx2-5ΔTrbE14 ($ p < 0,02 (apex) and $$ p < 0,01 (mid) vs Nkx2-5ΔTrbE10, N = 3).

