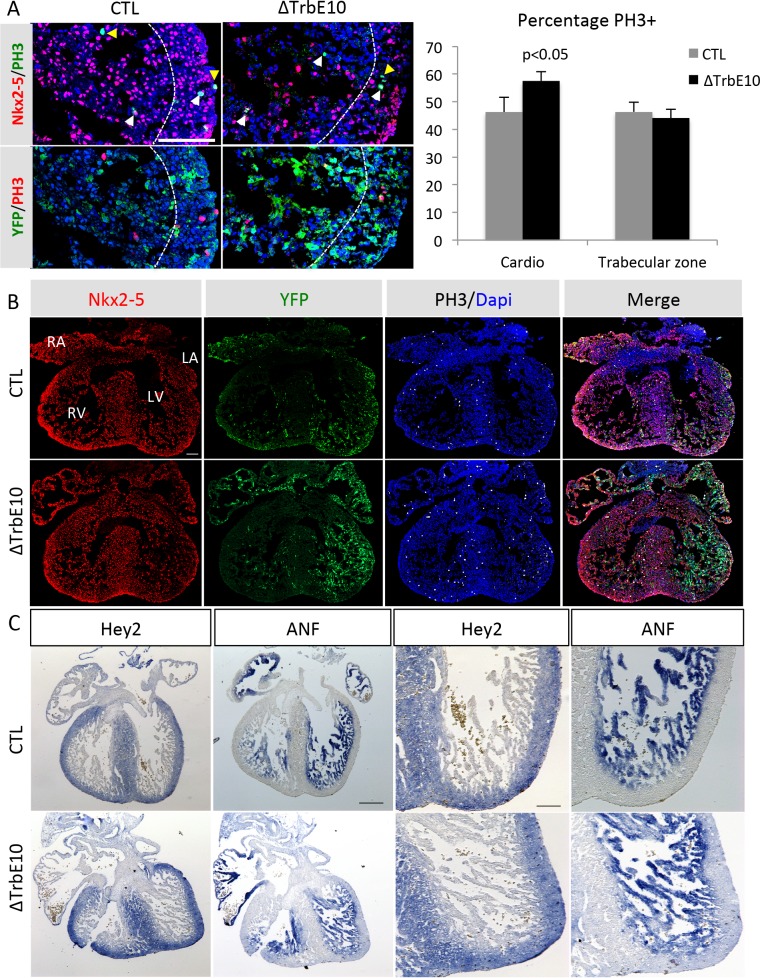
Fig 4. Analysis of proliferation and the compact trabecular boundary in fetal mutant hearts.
(A-B) PhosphoHistoneH3/Nkx2-5/YFP immunofluorescence of left ventricular cardiomyocytes from E14.5 control and Nkx2-5ΔTrbE10 (∆TrbE10) hearts. White and yellow arrows indicate PH3+ cardiomyocytes and non-cardiomyocytes, respectively. The boundary between the trabecular and compact zones is indicated by a dotted line. The graph shows the percentage of PH3+ cardiomyocytes per section and the percentage of these PH3+ cardiomyocytes in the trabecular zone. Quantification was performed on 3–4 sections per heart (N = 3); *p<0.05 control vs Nkx2-5ΔTrbE10. Scale bar = 100μm. (C) In situ hybridization using ANF (Nppa) and Hey2 riboprobes on left ventricular cardiomyocytes of E14.5 control and Nkx2-5ΔTrbE10 (∆TrbE10) fetal hearts. Scale bar = 200μm. Right: high magnifications of left ventricles. Scale bar = 100μm.

