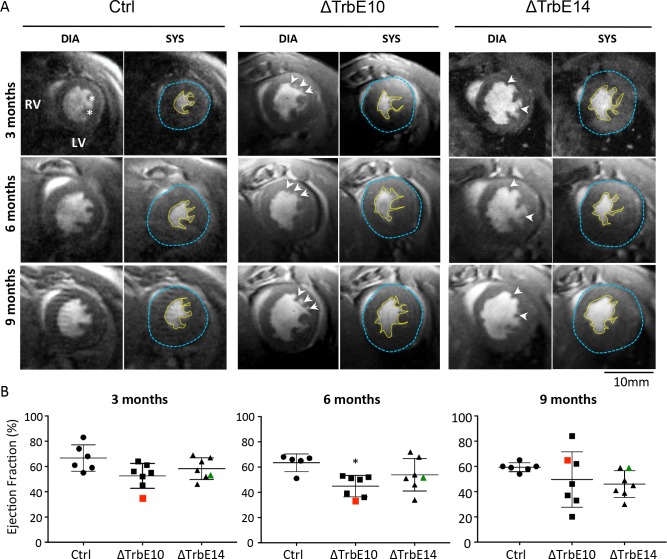
Fig 5. Longitudinal study of cardiac function by magnetic resonance imaging in Nkx2-5 conditional mutant mice.
(A) Short-axis cine images recorded by MRI at end-diastole (DIA) and end-systole (SYS). Images represent the follow-up of the same heart per mutant groups at 2–4, 6–8 and 9–10 month-old, with the yellow line indicating the endocardial outline and the blue line indicating the epicardial outline. Signs of hypertrabeculation are highlighted by arrows, and papillary muscles by stars. (B) Boxplot graphs represent the evolution of the ejection fraction (EF) measured in the same mice over a year. The EF corresponding to the LV capacity of contraction, was estimated by manually volumetric measurements from cine long and short axis images. Each dot represents an individual mouse. Red and green dots represent mice associated with contraction defects and fluctuating EF over time. (N = 6 in control and N = 7 for Nkx2-5ΔTrbE10 and Nkx2-5ΔTrbE14). Defects in six-month old Nkx2-5ΔTrbE10 were significant vs control, *p = 0,0165.

