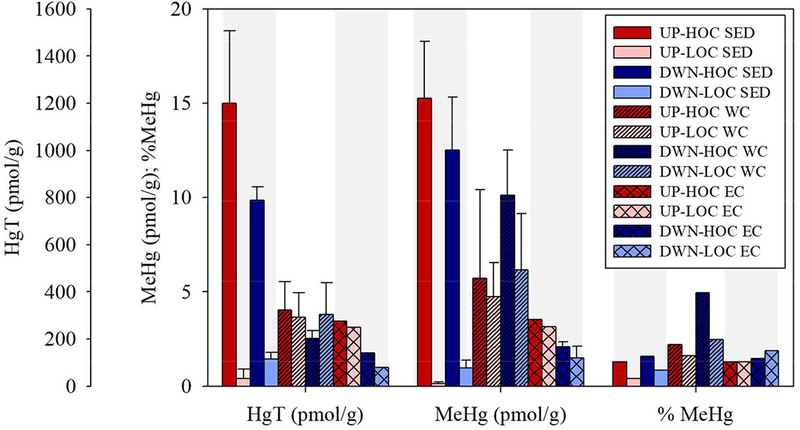
Figure 2.

Comparison of total mercury (HgT), methylmercury (MeHg), and % MeHg from bulk sediment samples (SED; 0–4cm; solid bars), bulk water column particulates (WC; diagonally hatched bars), and particles collected from the erosion core experiment 0.01–0.2 Pa summed shear stresses (EC; cross-hatched bars). Error bars represent the standard deviation of field duplicates. DWN-HOC and DWN-LOC had erosion core duplicates. Water column samples are averaged over high tide and low tide. Analytical errors are given in Table S2 of SI. The sites are delineated by bar shade in order from upstream (UP) to downstream (DWN), high organic carbon (HOC, based on sediment type) and low organic carbon (LOC) (SI Fig. S1); UP-HOC is dark, UP-LOC is medium dark, DWN-HOC is medium light, and DWN-LOC is light.
