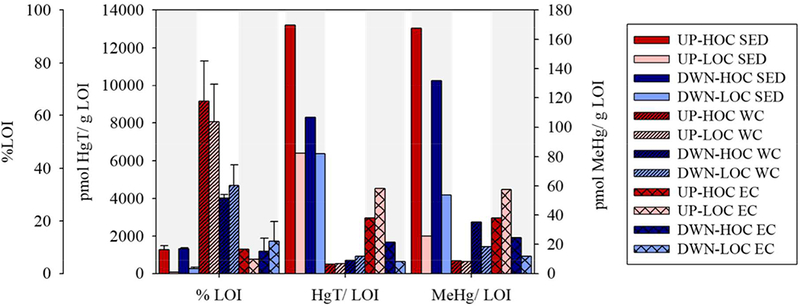
Figure 3.

Organic matter measured as percent loss on ignition (%LOI) at 550°C and mercury (total, HgT; methylmercury, MeHg) normalized to %LOI in the bulk sediment (SED; 0–4cm; solid bars), bulk water column particulate averaged over high tide and low tide (WC; diagonally hatched bars), and particles collected from the erosion core experiment 0.01–0.2 Pa summed shear stresses (EC; cross-hatched bars). Error is detailed in the text and in SI Table S2. The sites are delineated by bar shade, as in Fig. 2, in order from upstream to downstream (SI Fig. S1) the same way as Fig. 2.
