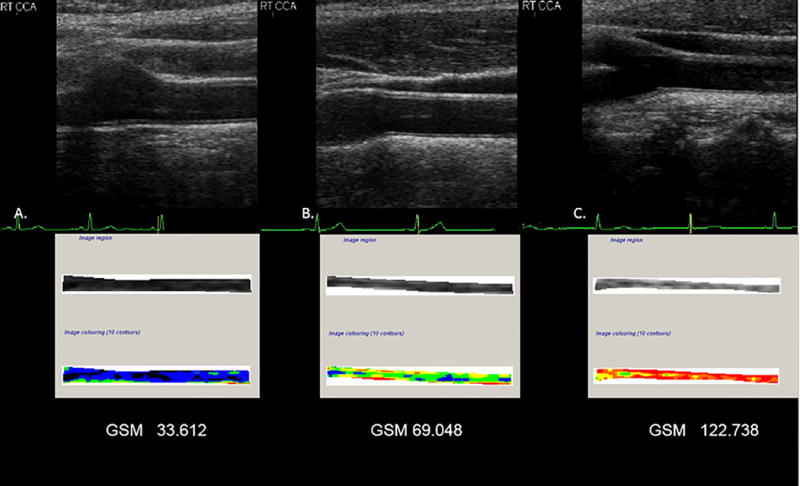
Figure 4.

Sonographic image and corresponding grayscale analysis of the arterial wall. Panel A, demonstrates the normalized and standardized B-mode image and associated tracing of the far wall of a common carotid artery for GSM. This artery is more echolucent. Panel B, demonstrates the normalized and standardized B-mode image and associated tracing of the far wall of a common carotid artery for GSM. This artery is representative of the mean GSM value of the study cohort. Panel C, demonstrates the normalized and standardized B-mode image and associated tracing of the far wall of a carotid artery for GSM. This artery is less echolucent. Image colorization (10 contours) depicts the far wall of a common carotid artery based on the local GSM value. Values of 0-25 units are displayed as black, 26-50 as blue, 51-75 as green, 76-100 as yellow, 101-125 as orange, and 126-255 as red40.
