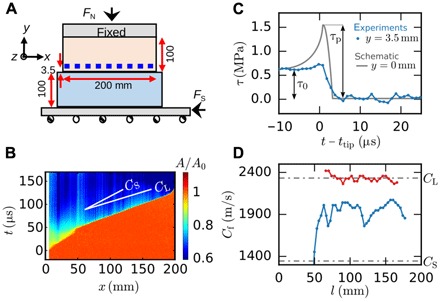
Fig. 1. Experimentally measured supershear rupture velocities.

(A) Two PMMA blocks are used in a stick-slip friction experiment. We consider the elastic medium to be 2D with a quasi 1D frictional interface and measured the full 2D tensorial strains along and ≈3.5 mm above the frictional interface (blue squares). (B) Real contact area A(x, t) measurements along the interface, normalized before the event, show rupture nucleation at x ≈ 0, acceleration, and transition to supershear at x ≈ 50 mm. (C) Shear stress variations, τ = σxy – , relative to the rupture tip arrival time, ttip, measured at x = 105 mm. Arrows denote the dynamic stress drop τ0 and peak shear strength τp. We obtain τp from the measured cohesive zone size. The gray curve schematically depicts the interfacial shear stress evolution. (D) Measured rupture velocities for two examples of rupture events in experiments with a dry interface. (B), (C), and the blue example in (D) correspond to the same rupture event.
