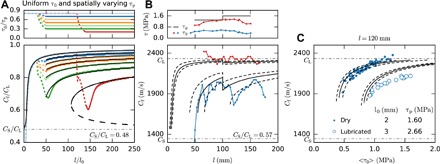
Fig. 2. Comparing theoretical predictions of supershear crack velocities with numerical simulations and experimental measurements.

(A) Top: Spatially uniform τ0 and nonuniform τp profiles are considered in simulations. The imposed τ0/τp profiles are shown. Bottom: Colors represent the crack velocities Cf(l) corresponding to the stress profiles in the top panel. τp is low, dashed lines, near the point of nucleation (l/l0 = 0) and increases at distances 50 for τ0/τp > 0.2 and at l/l0 = 130 for τ0/τp = 0.2 (red). Black solid lines denote predictions of Eq. 1. For sufficiently low τ0/τp (red example), two solution branches to Eq. 1 exist (dashed line shows the unstable solution). (B) Top: Profiles of the measured shear stress τ0 and estimated interfacial strength τp in experiments. Bottom: Measured rupture velocities for rupture events with stresses shown in the top panel. Theoretical predictions according to Eq. 1 are shown (solid lines); average τ0 values are used, l0 = μГ/ = 2 mm. Dashed lines correspond to the error estimates of l0 and τp. (C) Cf, measured at l = 120 mm (averaged over ±10 mm), for multiple experiments is plotted with respect to the measured τ0 profiles averaged over the same interval. Solid dots and open circles indicate experiments performed with dry and boundary-lubricated interfaces, respectively. Black lines are the theoretical predictions with the estimated errors.
