
Fig. 3. Minimal lengths exist for supershear crack propagation under uniform loading.
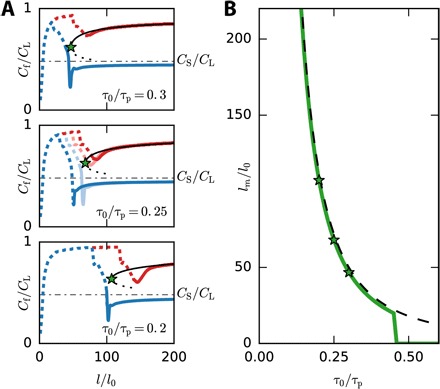
(A) Crack simulations for nonuniform τ0/τp profiles (see Fig. 2A, top), where the size of the weak patch is varied. Dashed and solid curves indicate propagation within the weak and strong regions, respectively. τ0/τp values in the figure correspond to the strong region (in the weak region, τ0/τp = 0.8). Supershear propagation in the strong region cannot be sustained for l < lm (lm is indicated by stars), where the supershear–to–sub-Rayleigh transition occurs. (B) lm obtained numerically (green line) from Eq. 1 shows that no minimal length exists for τ0/τp ≳ 0.45 (for fixed CS/CL). Normalization by l0 and τp is applied for convenient comparison to (A). Stars correspond to the values denoted in (A). The dashed line is the analytic approximation based on Eq. 2.