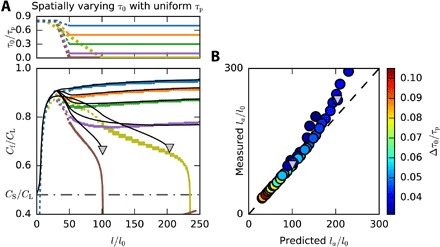
Fig. 4. Comparing theoretical predictions of supershear rupture velocities to numerical simulations for nonuniform prestress.

(A) Top: Spatially nonuniform τ0 profiles with uniform τp profiles are considered. The imposed τ0/τp profiles are shown. Bottom: Rupture velocities Cf(l) corresponding to the stress profiles in the top panel. Top and bottom: A high-stress nucleation patch (τ0/τp = 0.8 region) facilitates a direct supershear transition. Black solid lines show theoretical predictions for the nonuniform loading described by Eq. 3. Note the difference of Cf(l) profiles with those in Fig. 2A for similar τ0/τp profiles. Predicted locations for supershear–to–sub-Rayleigh transition are marked by gray triangles. (B) Comparison of supershear–to–sub-Rayleigh transition positions measured in 50 simulations, with the predicted transition position based on Eq. 3. In the considered τ0(x) profiles, the size of the high-stress nucleation patch is modified [see yellow curve in (A)]. Dashed line with slope 1 and is given for reference. Colors indicate the minimal needed increase in τ0 within the low-stress region that would negate the predicted supershear–to–sub-Rayleigh transitions. Gray triangles denote the simulations shown in (A).
