
Fig. 5. The effect of sub-Rayleigh–to–supershear transition on the equation of motion of supershear cracks.
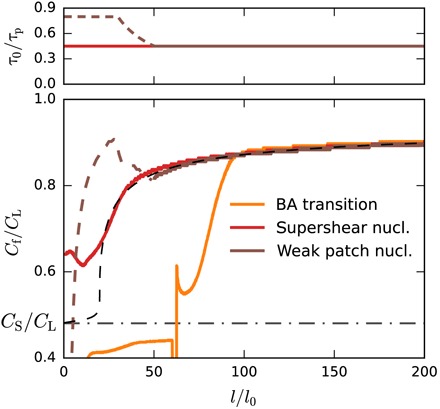
Three different transition mechanisms are considered. Top: The first setup (brown curve) has a spatially nonuniform τ0/τp profile with reduced local τp for l/l0 < 50 (see main text for details). Two additional examples have spatially uniform τ0/τp profiles (orange and red curves). Bottom: Colors represent the crack velocities Cf(l) corresponding to the stress profiles in the top panel. Brown curve indicates continuous crack acceleration to supershear speeds (direct transition) within a weakened nucleation (nucl.) patch (high τ0/τp level). Orange curve indicates sub-Rayleigh rupture transitions at l/l0 ≈ 65 to supershear speed through the Burridge-Andrews (BA) mechanism (4, 5). Red curve indicates an imposed supershear seed crack leads to a self-sustained supershear crack propagation. The black dashed line denotes theoretical prediction for a spatially uniform prestress level (τ0/τp = 0.45).