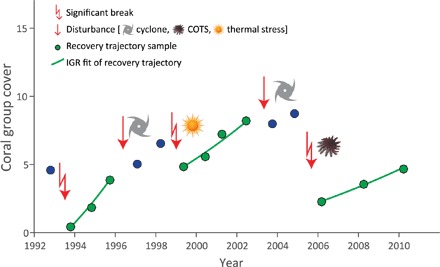
Fig. 1. A schematic to illustrate how recovery trajectories were defined for each of the six coral groups.

Points represent observed coral cover through time. Green points are samples within recovery periods, and blue points are observations outside of recovery periods. Recovery trajectories begin at either the beginning of the time series or after a significant break (decline). Recovery trajectories end with either an acute disturbance (COTS, cyclones, or thermal stress), a significant break, or the end of the time series. The IGR for each recovery trajectory is calculated. Note that not all significant breaks were explained by acute disturbances. The examples of coral cover trajectories for each coral type are shown in the Supplementary Materials. COTS, cyclone, and sun symbols are from T. Saxby (Integration and Application Network, University of Maryland Center for Environmental Science; http://ian.umces.edu/imagelibrary/). COTS, crown-of-thorns starfish.
