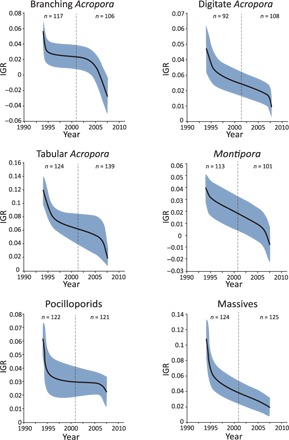
Fig. 2. Temporal trends in the IGR of major coral taxa on the GBR.

Solid lines represent the mean, and blue areas indicate the SE. Dashed lines denote mean midpoints of the recovery trajectories. n values represent the number of trajectories before and after the mean trajectory midpoint. Note different scales on the y axes.
