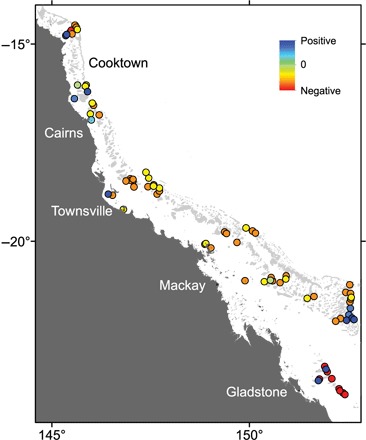
Fig. 3. Spatial distribution of change in reef recovery rates (IGR) for tabular corals of the genus Acropora.

We chose tabular Acropora here because it is the dominant coral group (by abundance and frequency) and alone represents 30% of mean total coral cover of the groups we include. In addition, it has the largest number of recovery trajectories. Colors represent change in IGR between the first half and second half of the data set. Recovery trajectories were divided between two time periods, so temporal differences could be calculated: The earlier half included 131 recovery trajectories that all ended by 2003 with a mean trajectory midpoint of year 1995; the latter half included 132 trajectories that all ended after 2005 with a mean midpoint of 2007. Temporal change in IGR was calculated per reef [(later − earlier)/earlier] using mean IGR for cases where a reef had multiple trajectories per time period. In the cases where a reef did not have a value for the before or after period, inverse distance weighted interpolation was used to obtain the corresponding value. An autocorrelation analysis that evaluates the appropriateness of the interpolation is shown in the Supplementary Materials.
