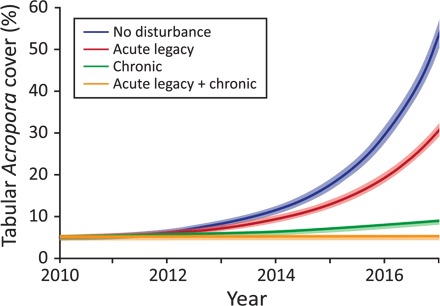
Fig. 5. Projected recovery after the study period under different disturbance scenarios.

We use here Penrith Reef (a mid-shelf reef in the southern GBR) as example (see fig. S2 for examples from other reefs). Lines show the projected coral cover at the reef based on the IGR predicted from the statistical model. Shaded ribbons shows variability when the parameters are varied by 5%.
