
Fig. 2. Seasonal effects of maximum ozone (ppb) on visitation.
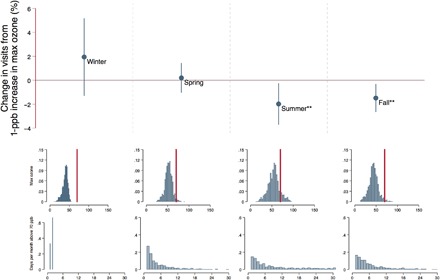
(A) Mean estimate and 95% confidence intervals for the effect of maximum ozone on visitation by season. (B) Seasonal histograms of maximum ozone. The red line indicates the 70-ppb threshold. (C) Seasonal histograms of average monthly exceedance days. ***P < 0.01, **P < 0.05, and *P < 0.1.