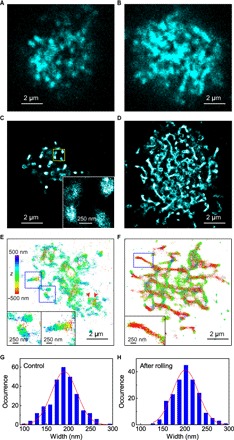
Fig. 2. SR localization microscopy imaging of CD44 on KG1a cells.

(A) Confocal fluorescence image of CD44 on a KG1a cell that was fixed and immunolabeled for CD44 using the 515 antibody followed by AF-647–conjugated secondary antibodies. (B) Confocal fluorescence image of CD44 on a KG1a cell that was fixed and immunolabeled by AF-647 dye in the microfluidic chamber after the rolling of the cell on E-selectin. (C) SR image of CD44 on a KG1a cell that was fixed and immunolabeled for CD44 using the 515 antibody followed by AF-647–conjugated secondary antibodies. The inset shows an enlarged view of the yellow region. (D) SR images of CD44 on a KG1a cell that was fixed and immunolabeled by AF-647 dye in the microfluidic chamber after the rolling of the cell on E-selectin. (E) 3D SR image of CD44 on a KG1a cell that was fixed and immunolabeled by AF-647 dye in suspension. The insets show enlarged views of the blue regions. (F) 3D SR images of CD44 on a KG1a cell that was fixed and immunolabeled by AF-647 dye in the microfluidic chamber after the rolling of the cell on E-selectin. The inset shows an enlarged view of the blue region. (G) Frequency histogram of the width of the CD44 clusters observed in the control cells. (H) Frequency histogram of the width of the CD44 clusters observed in the rolled KG1a cells.
