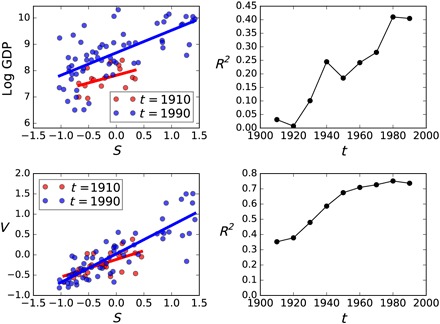
Fig. 3. Emergence of the correlation between secularization and development during the 20th century.

The top left panel shows scatter plots for secularization, St, against log GDPt per capita (normalized to 1990 US$), for people born in 1910 and 1990, where each point is a country. The top right panel shows R2 values for GDPt versus St, for the decades of the 20th century, t. The bottom left panel shows the same scatter-country plot for St against Vt for people born in the 1910s and the 1990s. The bottom left panel shows the progression of this correlation through the decades of the 20th century.
