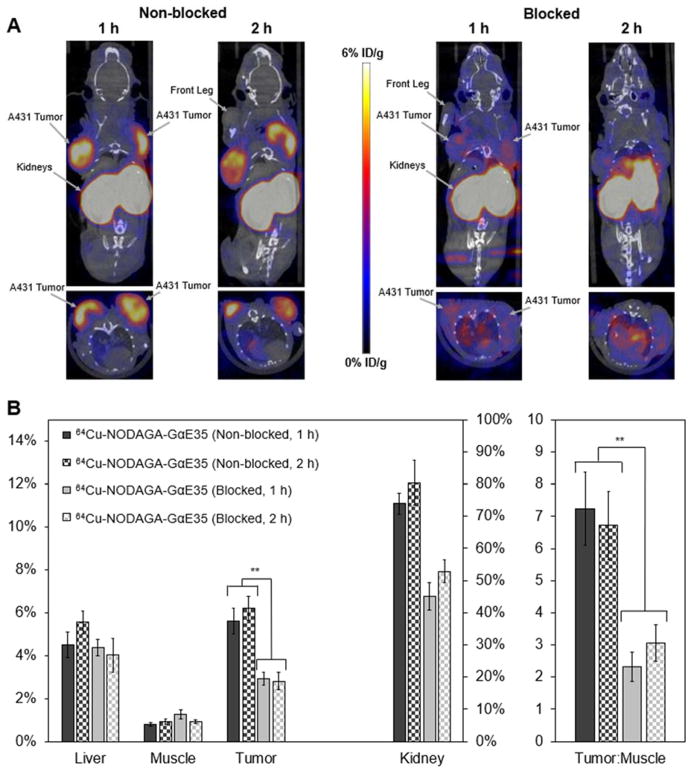
Figure 7.
(A) PET/CT Imaging. Mice xenografted with two A431 (EGFRhigh) tumors on opposing shoulders were intravenously injected with either 64Cu-NODAGA-GαE35 (Non-blocked) or NODAGA-GαE35 at 102 ± 29-fold molar excess followed by 64Cu-NODAGA-GαE35 5–10 minutes later (Blocked) and imaged via PET/CT at 1 and 2 h post-injection. Coronal and transverse slices through tumors are shown for representative mice (n = 4). (B) PET imaging quantification. Signal in the liver, muscle, tumors, and kidney were quantified using Siemens Inveon research software at 1 and 2 h post-injection (**: p < 0.01).

