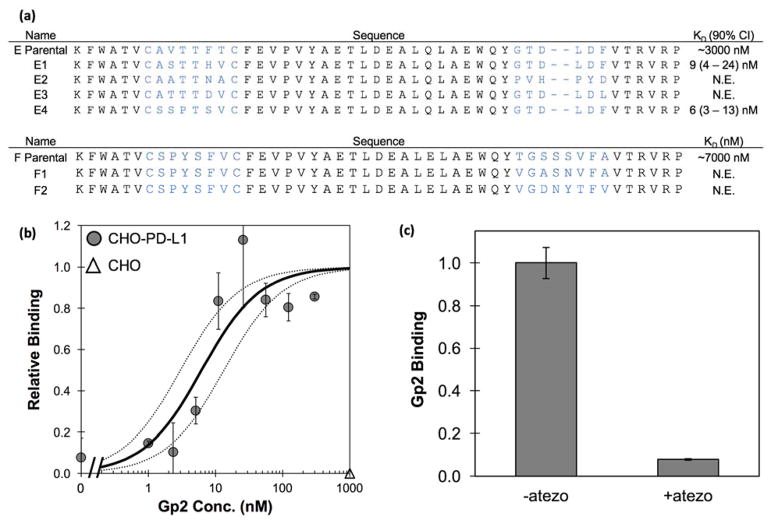
Figure 10. Characterization of strongest binding evolved and parental PD-L1 binding Gp2.
A) Clones E1 and E4 were produced at measurable levels in the soluble fraction using E. coli. Their binding affinity (KD) was determined with n=3 trials (90% confidence interval indicated); N.E. indicates not expressed. (B) Purified Gp2-PDL1E4 was added at the indicated concentrations to CHO cells (transfected for PD-L1 expression: filled circles; untransfected: empty triangle). Binding was detected by fluorophore tagged anti-His6 antibody via flow cytometry. The best-fit estimate of the Kd (6 nM) and the 90% confidence interval (3 – 13 nM) are indicated by solid and dashed lines, respectively. (C) CHO cells transfected for PD-L1 expression were treated, at 4 °C, with 300 nM Gp2-PDL1E4 in the absence or presence of initial treatment with 67 nM atezolizumab. Binding was detected by fluorophore tagged anti-His6 antibody via flow cytometry.

