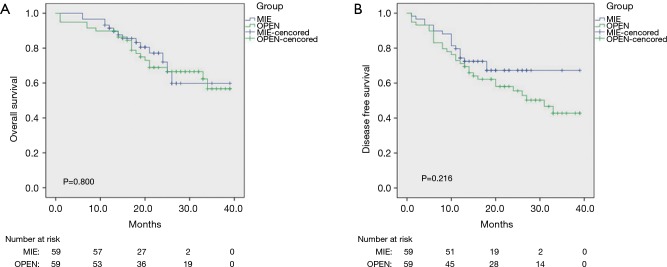
Figure 7.
Kaplan-Meier curves of the survival among 118 patients with pathologic T3 esophageal cancer after matching. (A) The overall survival curve of the two groups after propensity score matching; (B) the disease-free survival curve of the two groups after propensity score matching. MIE, minimally invasive esophagectomy.

