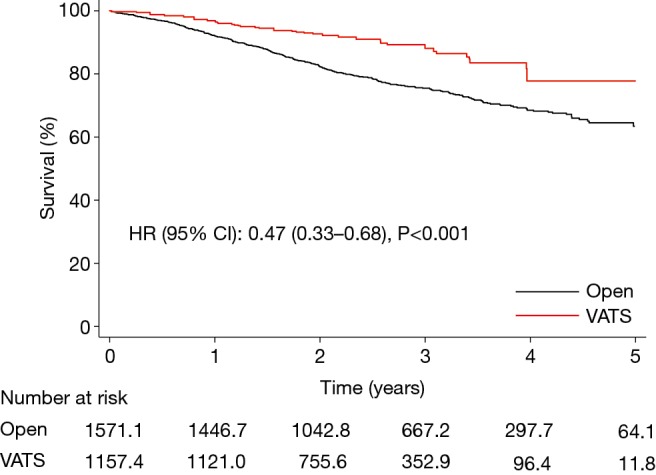
Figure 3.

Survival after open thoracotomy or minimally invasive lobectomy. Survival is plotted against time after surgery and stratified according to type of surgery, open thoracotomy (black line) or minimally invasive lobectomy (red line). The group of patients who underwent open thoracotomy lobectomy (black line) is the reference group. Note that the numbers of patients at risk shown below the graph are not necessarily integers owing to inverse probability of treatment weighting. HR, hazard ratio; CI, confidence interval; VATS, video-assisted thoracoscopic surgery.
