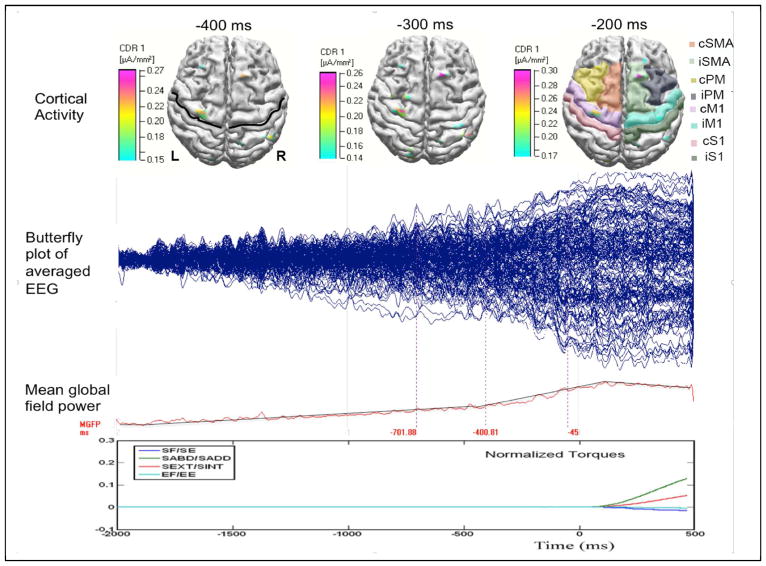
Figure 2.
Typical data in a healthy control subject during SABD task. The top row shows the reconstructed cortical activity at −0.4, −0.3, and −0.2s, with 0 respect to the onset of the torque. In the subplots at −0.4 and −0.2s, the central sulcus and the 8 ROIs are marked by a black line and shades with different colors. The 2nd and 3rd rows show the butterfly plot and the mean global field power of the average EEG. The last row shows the normalized torques generated at the shoulder and elbow. The torque reaches peak about at 1.2s, which is truncated in this plot.

