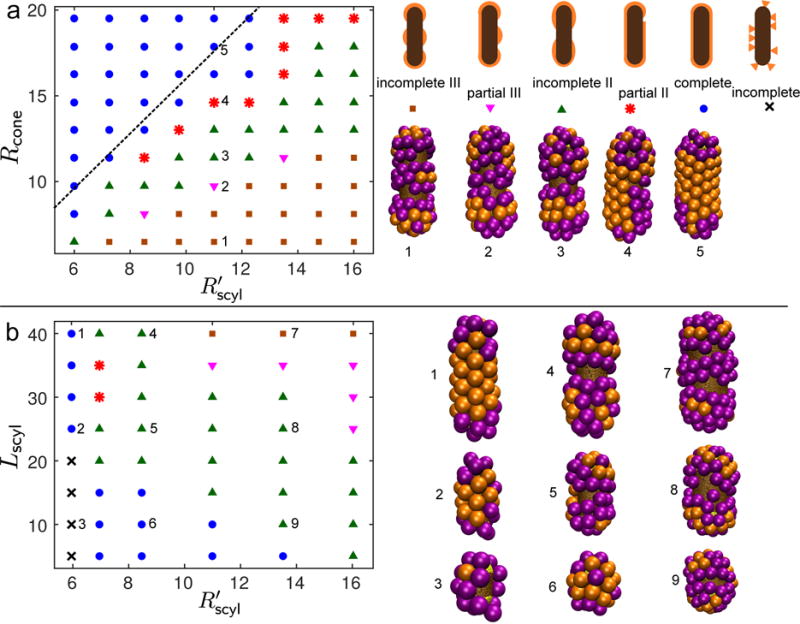
FIG. 3.

(a) Phase diagram of the most frequent simulation outcomes as a function of the capsomer spontaneous curvature radius Rcone and spherocylinder radius , for a spherocylinder length of Lcyl = 40nm. On the right, we show a schematic for each class of assembly outcome along with a representative example from the simulations. The outcomes are numbered the same as the corresponding parameters on the phase diagram. The dashed line shows the threshold above which the continuum theory (Eq. (8)) predicts that assembly is more favorable on the cylindrical shaft than on the spherical end caps. (b) Phase diagram of the most frequent outcomes as a function of the spherocylinder length Lcyl and radius Rscyl, for constant Rcone = 9.5nm. Legend as in (a). On the right we show some typical simulation snapshots for relevant spherocylinder aspect ratios. We performed 5-10 independent simulations at each parameter set. The distribution of outcomes for representative parameter values is shown in the supplemental figure [84].
