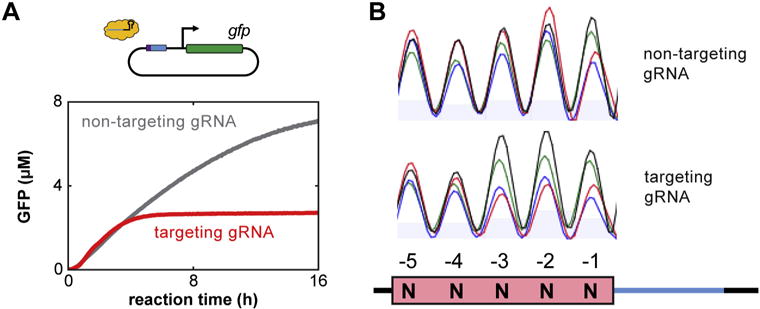
Fig. 2.

Data analysis for assessing cleavage by a Cas nuclease in TXTL. (A) A representative GFP cleavage analysis tracking fluorescence of GFP over time is shown. The red and gray lines indicate TXTL reactions containing a Cas nuclease with a gRNA targeting the GFP reporter or a non-targeting gRNA, respectively. At earlier times, GFP fluorescence is similar for both reactions. After a few hours, the reaction containing the GFP-targeting gRNA cleaves the reporter plasmid, and GFP production ceased, while in the reaction containing the non-targeting gRNA GFP continues being produced for ~16 h. (B) An example comparison between two trace files obtained from Sanger sequencing. The images show chromatograms obtained by PCR amplifying directly from two TXTL reactions. Each reaction was conducted with the FnCas12a nuclease, a 5-nt randomized PAM library, and either the non-targeting (top) or targeting (bottom) gRNA. Cleavage with the targeting gRNA shows noticeable depletion of nucleotides C and T in the −2 and −3 positions relative to cleavage with the non-targeting gRNA. The inconsistent nt abundance in the non-targeting gRNA sample can be attributed to varying frequencies of each sequence in the PAM library. (For interpretation of the references to colour in this figure legend, the reader is referred to the web version of this article.)
