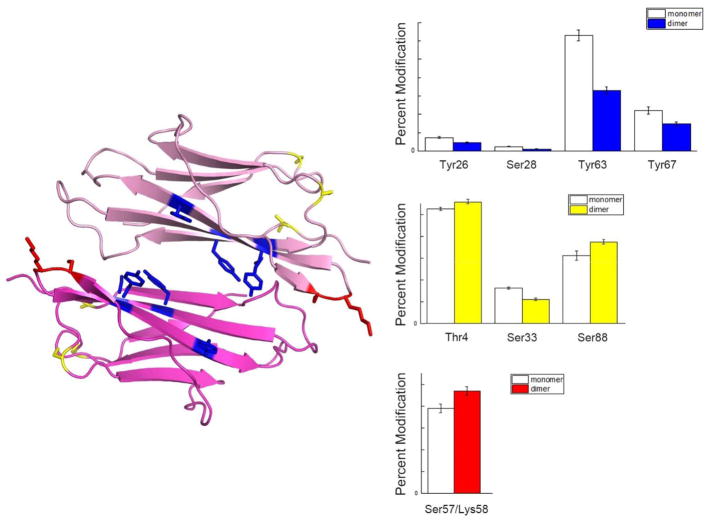
Figure 6.
An example of how changes in labeling level can be applied to predict the protein dimer interface demonstrated with β2m dimer structure extracted from β2m H13F hexamer (PDB 3CIQ). Blue colored residues indicate significant decreases in labeling level from monomer to dimer, which helps locate the dimer interface. Yellow colored residues show no significant change in labeling level, which indicates these residues are at a region away from dimer interface. The red colored residues are examples of residues with increases in labeling levels, indicating these residues becomes more solvent exposed upon dimer formation.

