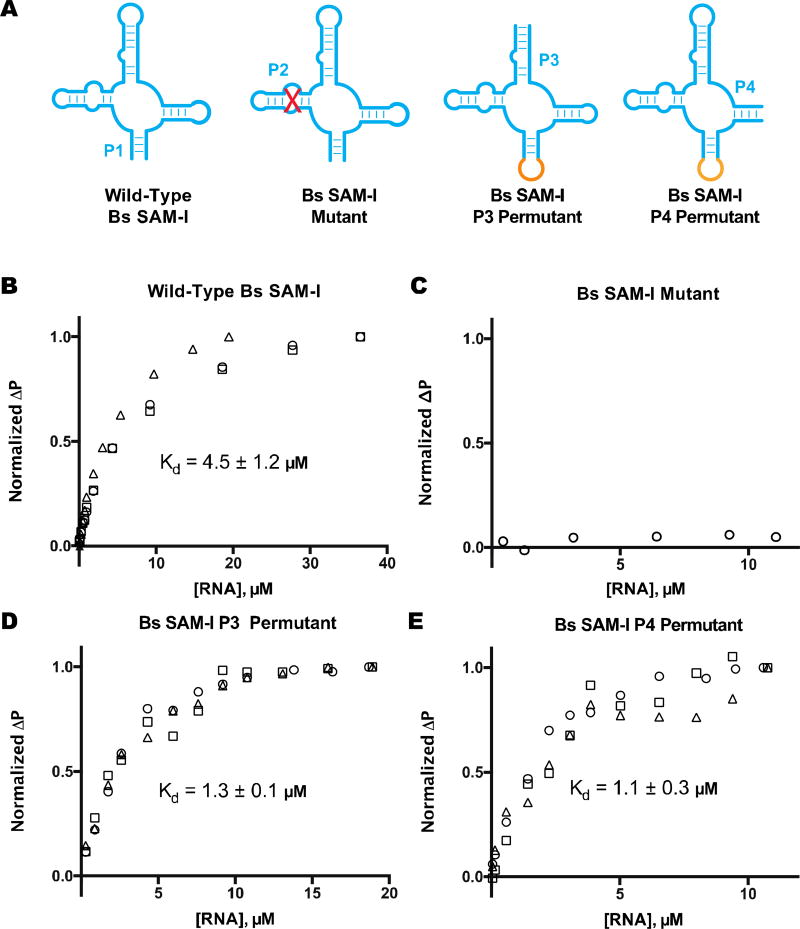
Figure 3.
Ligand binding analysis of SAM-I riboswitch aptamers. (a) Schematic of SAM-I riboswitch aptamer, mutant, and permutants. Fluorescence polarization data is shown for Cy5-labeled SAM analog with (a) wild-type Bs SAM-I (P1–7 stem), (b)Bs SAM-I mutant (P2 disruptive mutation), (c) Bs SAM-I P3 permutant (P3–5 stem), and (d) Bs SAM-I P4 permutant (P4–6 stem). Different symbols indicate independent replicates. Change in polarization (ΔP) was normalized to the maximal difference observed at the highest RNA concentration. The reported Kd value is the average of those calculated from best-fit curves with margin of error reported as SD. Data from part (a) and (b) were reproduced with permission from [18].

