
Figure 2. Maintenance of AURKA is associated with resistance to PI3K inhibition.
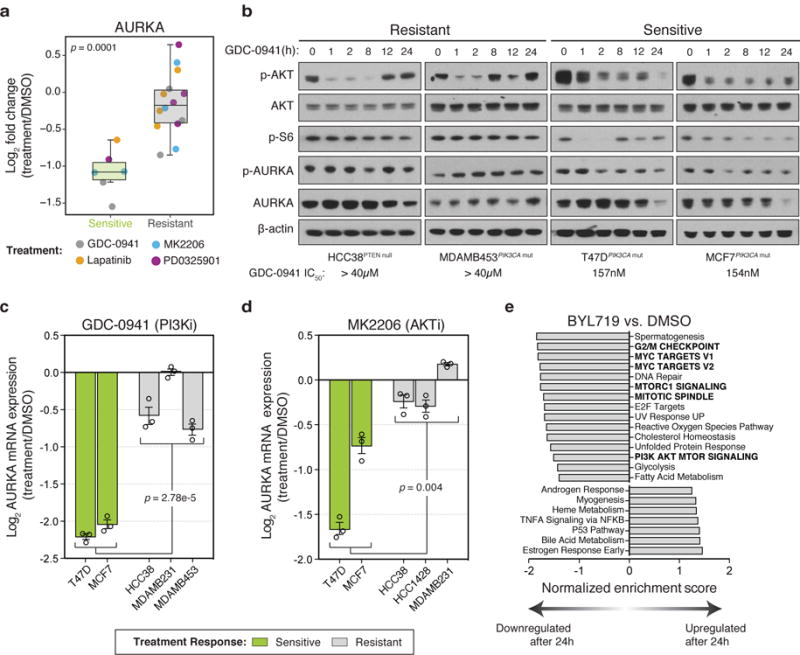
(a) Changes in activity of AURKA as measured by MIBs in drug-sensitive versus drug-resistant treatment responses after 24 hours of exposure to the indicated compounds. Each point reflects a single cell line and drug treatment (n=20 biologically independent samples). Box-and-whisker plots show median (centerline), upper/lower quartiles (box limits), and whiskers spanning the interquartile range from 25-75 percentiles. P value calculated using a two-sided t-test. (b) Western blot showing PI3K and AURKA signaling in GDC-0941-resistant and GDC-0941-sensitive cell lines. Protein lysates from cells treated with 1μM GDC-0941 were extracted at different points time, separated by SDS-PAGE, and analyzed by immunoblot with the indicated antibodies. Representative image of n=3 independent experiments (full blots shown in Supplementary Fig. 8). (c,d) Log ratio expression values of AURKA mRNA measured by RT-PCR from the indicated cell lines treated with (c) 1μM of GDC-0941 or (d) 1μM MK2206 for 24 hours and compared to DMSO treatment. Data represents n=3 biological replicates. Error bars are mean ± s.e.m. and p values calculated using one-way ANOVA. (e) Gene Set Enrichment Analysis (GSEA) of top gene sets significantly upregulated or downregulated after 24 hours in response to 1μM BYL719 treatment in MCF7 and T47D cells compared to DMSO. Data in panel (e) based on transcriptomic data from Bosch, et al.17