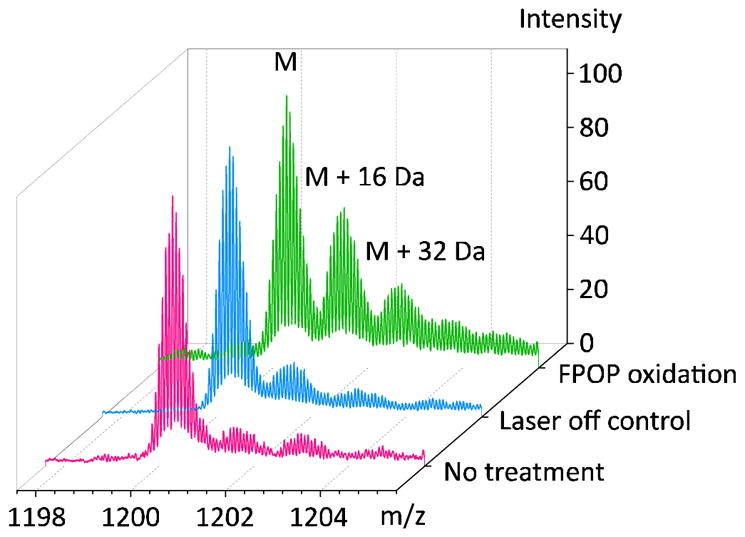
Figure 4.

Comparison of oxidation extent on calmodulin without any treatment (pink), with H2O2 and laser off (blue), with H2O2 and laser on (green). Charge state +14 is shown. FPOP experiment parameters: calmodulin 2 μM, histidine 2 μM, H2O2 20 mM, laser energy 24 mJ/pulse, spot width 2.2 mm, shot rate 7.2 Hz, capillary I.D. 150 μm, flow rate calculated and set as 22.4 μL/min, E.V. 25%.
