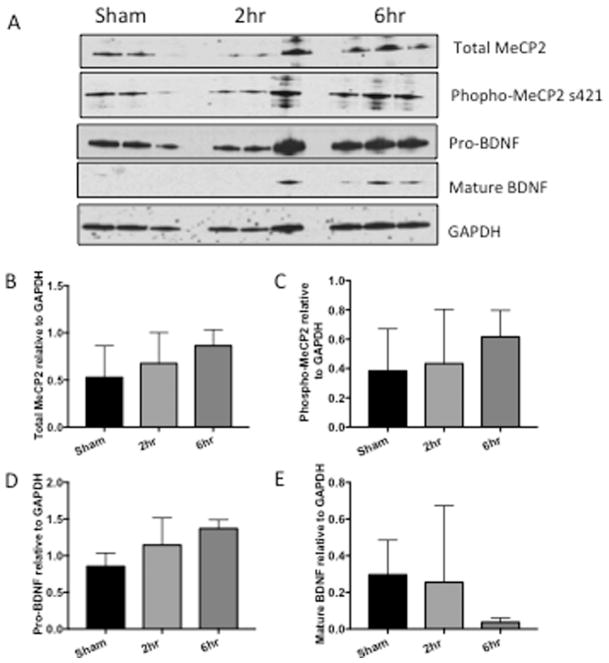
Figure 4. MeCP2 and BDNF are increased in frontal cortex of rats that self-administer cocaine.
A) Representative western blot of frontal cortex tissue from rats that self-administered cocaine for 19 days for either 2 or 6h/day. B) Graphic representation of changes in total MeCP2 normalized to GAPDH, p= 0.8085, 0.3847. C) Graphic representation of changes in phosphorylated MeCP2 normalized to total MeCP2, p= 0.9760, 0.6147. D) Graphic representation of changes in precursor BDNF (proBDNF) normalized to GAPDH, p= 0.3800, 0.0949. E) Graphic representation of changes in mature BDNF (mBDNF) normalized to GAPDH, p= 0.9807, 0.4970. Results are expressed as mean ± SEM, n≥ 3 and were analyzed utilizing One-way ANOVA with Tukey’s multiple comparison test. Sham represents saline control. NS is not statistically significant.

