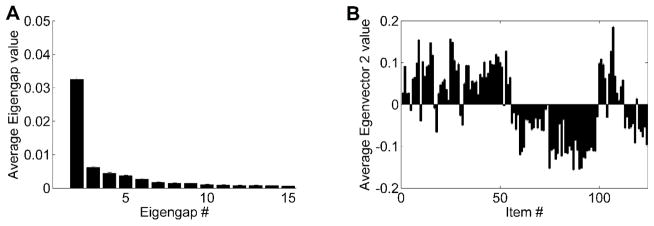
Figure 1. Spectral Clustering analysis of questionnaire items.
(A) Eigengap plot of the differences in magnitude between successive eigenvalues of the normalized graph Laplacian matrix, LNCut, of the similarity matrix, S, constructed for the 124 items (equation 2). This plot is an average of 100 eigengap plots, each of which was generated on a different randomly selected subsample of the study participants. Each such subsample comprised 50 subjects per group, drawn at random (with replacement) from among all subjects in each group. There is just one outstanding eigengap in this plot, Δλ2, between eigenvalues 2 and 3, indicating that the items form two prominent clusters. (B) Average 2nd eigenvector plot, showing average of the 2nd eigenvectors computed for the same 100 random subsamples of the study participants. The plot shows the graded membership of the 124 items in the two clusters indicated by the eigengap plot.

