. 2018 Jun 30;16(1):1–10. doi: 10.5049/EBP.2018.16.1.1

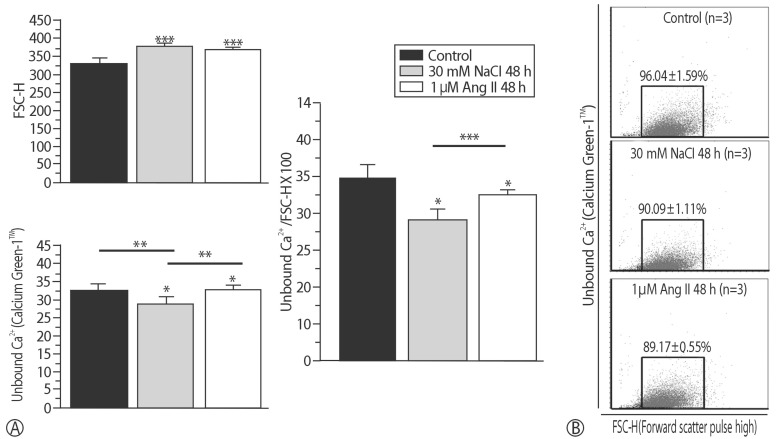
Fig. 6. Average intracellular free Ca2+ concentration in two hypertrophic models. (A) FSC-H increased in the Ang II model and further increased in the in vitro hypernatremic model, and fluorescent intensity increased in the Ang II model and decreased in the in vitro hypernatremic model. To sum up, the level of free Ca2+ in the region on the cell decreased in the Ang II model and further decreased in the in vitro hypernatremic model when fluorescent intensity was corrected to compensate the difference of cell size. (B) The two hypertrophic models shifted to the right and down. In in vitro hypernatremic model, it was more evident (*p<0.05, **p<0.01, ***p<0.001).

Fig. 6