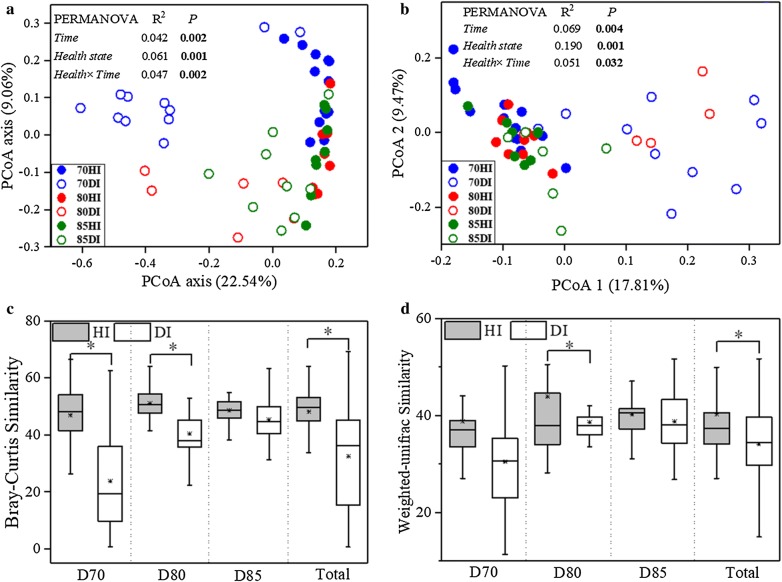
Fig. 2.
Principal coordinate analysis (PCoA) plots of community dissimilarities based on Bray–Curtis (a) and weighed Unifrac distance (b) between healthy and diseased shrimp gut across three sampling days. Sampling days exhibited with distinct colors (Blue: Day 70; Red: Day 80; Green: Day 85) and health state showed with the solid (Healthy) and hollow (Diseased). Permutational Multivariate Analysis of Variance (PERMANOVA) was used to test the significance of time, health state and their interaction in community variation at each day. Box plots of healthy and diseased gut bacterial communities based on Bray–Curtis (c) and weighed Unifrac (d) similarity within each and all sampling day. HI healthy gut; DI diseased gut. Significant differences were indicated by the asterisk (*P < 0.05) based on one-way analysis of variance. Lines at the top, bottom, and middle of the box correspond to the 75th, 25th, and 50th percentiles (median), respectively. The asterisk in the box represents the mean value

