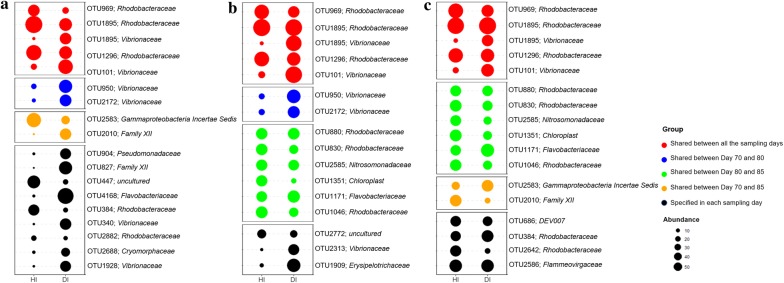
Fig. 3.
OTUs (relative abundance > 1%, classified at family level) that exhibited significant difference in relative abundance of healthy (HI) and diseased gut (DI) at day 70 (a), 80 (b) and 85 (c). The abundances of the indicator taxa were quarter square root transformed and showed with the size of bubbles from high to low

