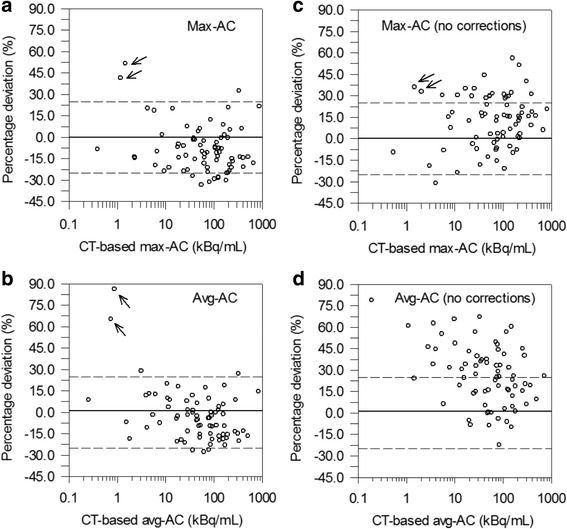
Fig. 1.

Percentage deviations between MR-based and CT-based ACs as a function of the CT-based max-AC and avg-AC with (a, b) and without corrections (c, d). Two outliers are marked with arrows. In panel d, the deviations of the outliers (98 and 142%) are beyond the axis scale and are not shown. Solid (dashed) lines represent the zero (± 25%) percentage deviations
