
Fig. 4.
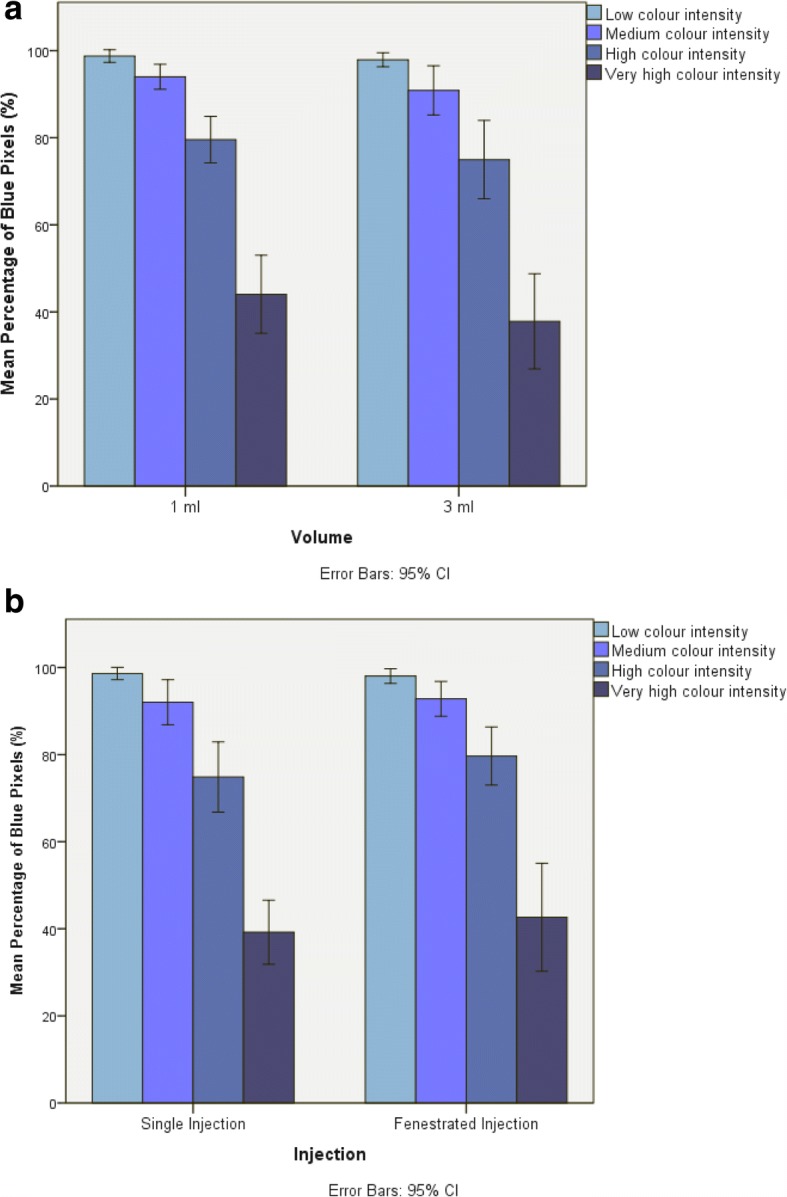
a Bar chart showing the mean percentage of blue pixels in each of the four colour intensity groups for the 1 ml and 3 ml volume injections. Error Bars = 95% Confidence Intervals. b Bar chart showing the mean percentage of blue pixels in each of the four colour intensity groups for the single injection and fenestrated injection techniques. Error Bars = 95% Confidence Intervals