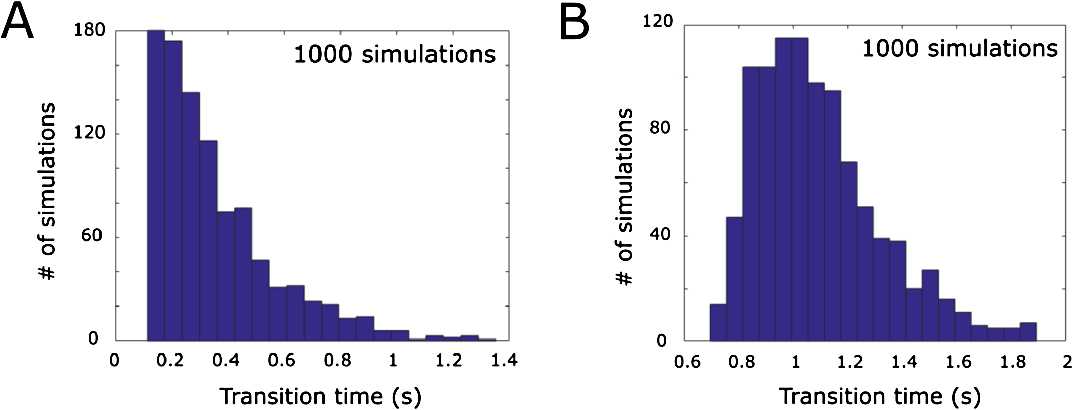
Fig. 10.

Distribution of times spent in the synchrony (double-synchrony) transition in the system with noise. (A) and (B) show the histogram of times spent in synchronous state before switching to swimming. The selected parameter values of (A) and (B) are the same as the ones used in Fig. 7(A) and (B), respectively
