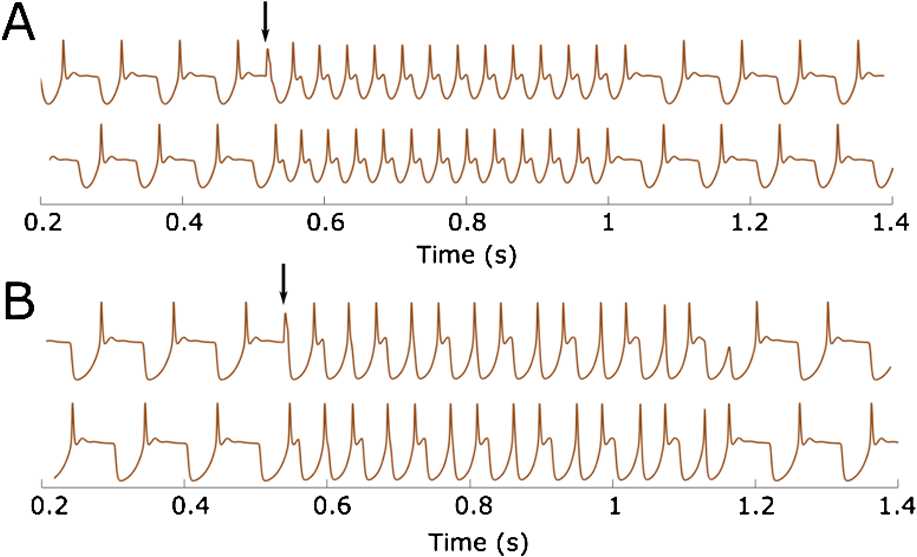
Fig. 11.

Plot of dIN voltage dynamics showing transitions from swimming to synchrony (A) or double-synchrony (B), and back to swimming. In both (A) and (B) a brief step current (0.45 nA, 5 ms) is manually injected to the left dIN at the time of right dIN firing (black arrows). Parameter values used to obtain (A) and (B) are the same as the ones used in Fig. 9(A) and (B), respectively, except that
