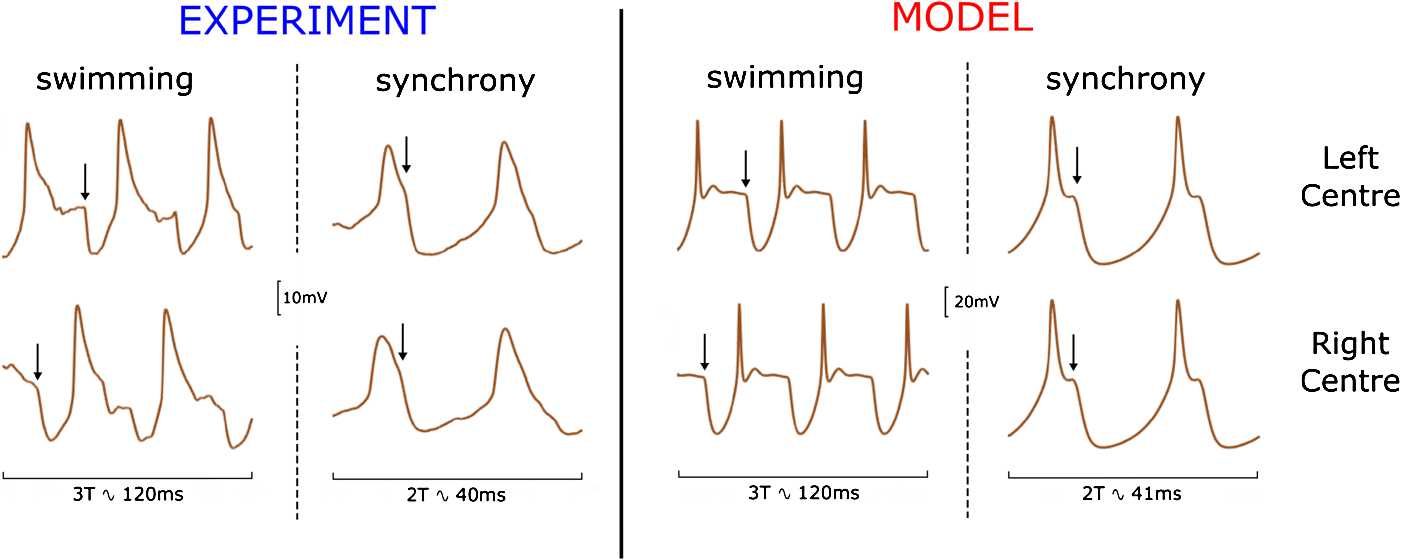
Fig. 3.

Voltage traces of dINs in the reduced model during swimming and synchrony. The left panel shows experimental pairwise recordings from one left-centre dIN and one right-centre dIN during swimming and synchrony. The right panel shows the voltage variable of the two dINs of the reduced model during swimming and synchrony. We show three cycles of swimming (3T) and two cycles of synchrony (2T) to highlight the characteristic shapes of the membrane potential during these two regimes and to compare experiments and model simulations. Arrows indicate the firing of cINs and mark the inhibition preceding PIR spikes in dINs. Model parameters used to obtain swimming are nS, nS and nS, with initiation parameters ms and ms. Model parameters used to obtain synchrony are nS, nS and nS, and initiation parameters ms and ms. The experimental recordings have been obtained using the same experimental protocols and conditions described in [12]
