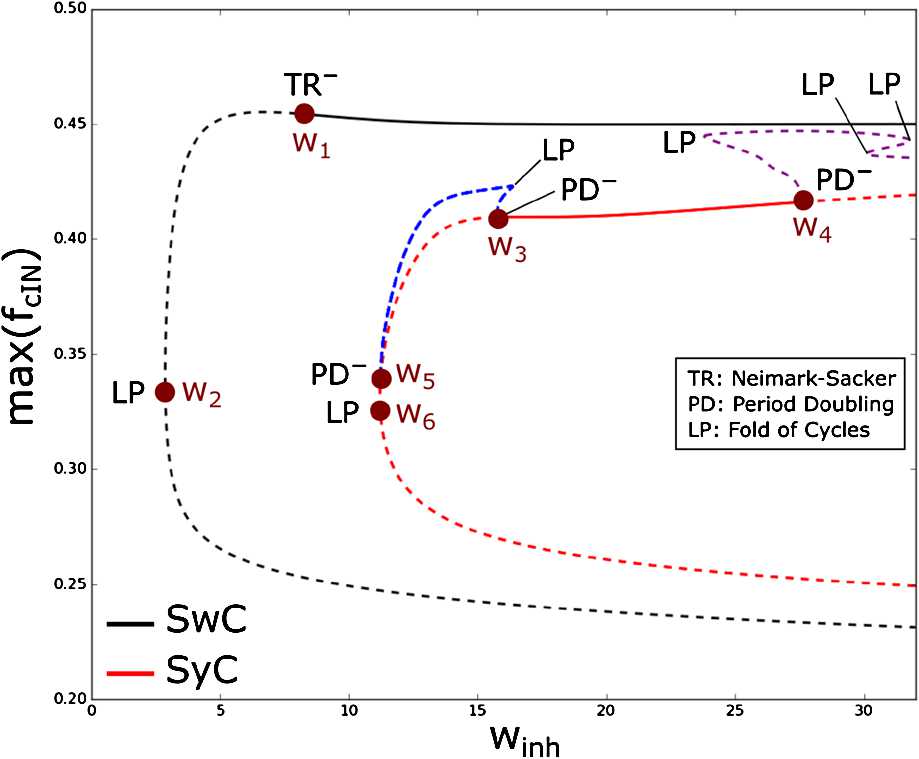
Fig. 4.

One-dimensional bifurcation diagram for the swimming (black) and synchrony (red) limit cycles at varying inhibitory strength . Blue and purple lines show two unstable limit cycles appearing at bifurcation points and , respectively. The y-axis shows the maximum of the -gating variable f of the left cIN for each limit cycle. Stable and unstable limit cycles are shown by continuous and dashed lines, respectively. The superscript − refers to subcritical bifurcations. Bifurcation parameter values (in nS) are the following: , , , , and
