
Figure 2.
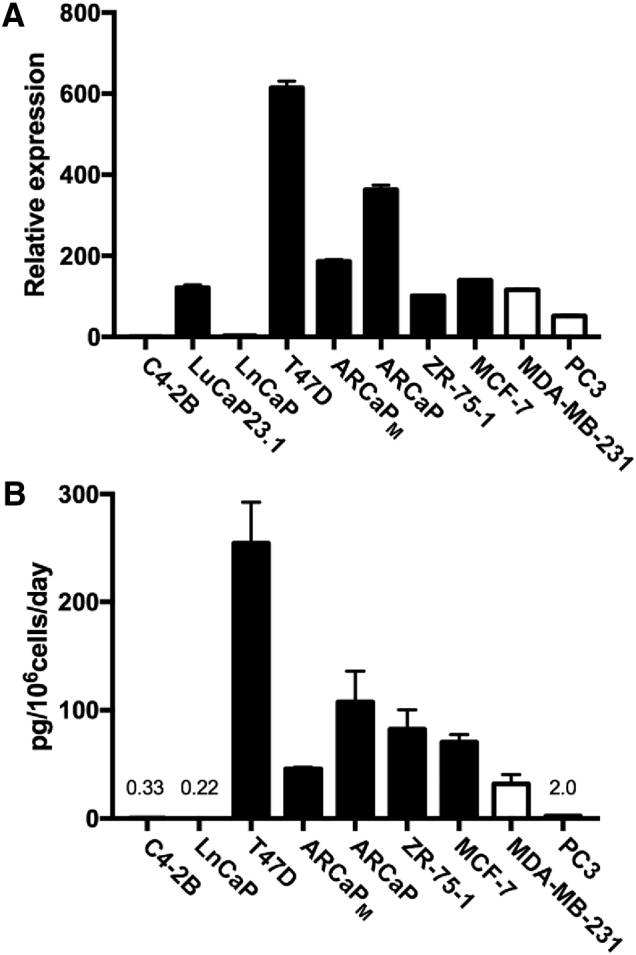
ET-1 mRNA and protein expression in cancer cells closely correlates with DKK1 expression in the cancer cells. (A) ET-1 mRNA was measured in the panel of breast and prostate cancer cell lines and the prostate cancer xenograft LuCaP23.1. (B) In the cell lines, the rate of ET-1 secreted into the surrounding medium was also measured by ELISA and normalized to cell number. Absolute ET-1 values in cell lines with the lowest expression are reported. Closed bars represent cancer cells that produce osteoblastic, mixed or no bone lesions in animal models of bone metastasis. Open bars represent cancer cells that produce osteolytic lesion in animal models of bone metastasis.