
Figure 1.
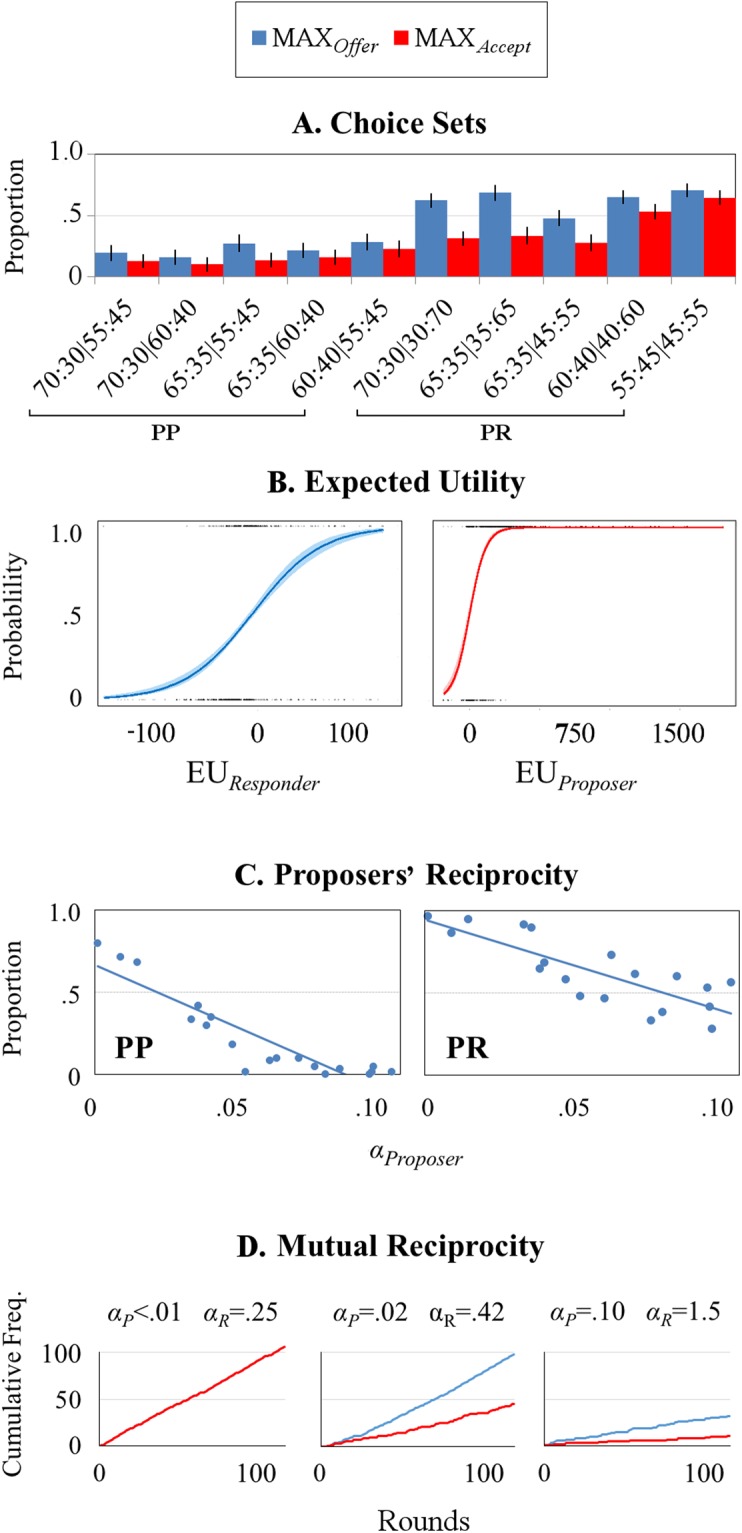
Patterns of player behaviour. (A) Mean (±SD) proportions of offers of maximal advantageous inequity (MAXOffers; blue) and their acceptance (MAXAccepts; red) across all dyads for each of the 10 choice sets. This indicates more MAXOffers and MAXAccepts across PR relative to PP rounds, which was confirmed with direct comparisons (see text). Error bars present standard deviations. (B) Probabilities of MAXOffers and MAXAccepts plotted as a logistic function of expected utility (EU), as estimated with the reciprocity model. (C) The proportion of MAXOffers in each condition plotted as a function of Proposers’ reciprocity (α), as estimated by the reciprocity model. This reveals that with increasing reciprocity, Proposers were less likely to offer the division that benefited themselves maximally. (D) Cumulative frequencies of MAXOffers and MAXAccepts over all 120 UG rounds, for three example dyads. For the leftmost dyad, estimates of reciprocity were low for both the Proposer (αP) and Responder (αR). This is reflected in high number of MAXOffers and MAXAccepts; the Proposer was free to offer divisions that benefited themselves maximally because the Responder did not challenge such proposals with rejections (negative reciprocity). In the middle dyad, the Responder did challenge MAXOffers and this is reflected in a higher reciprocity estimate. These rejections did not sway the Proposer, however; they continued to propose such offers, reflected in a low reciprocity estimate. In the rightmost dyad, estimates of reciprocity were high for the Proposer and Responder. This is reflected in a low number of MAXOffers and MAXAccepts; the Responder was unwilling to accept such offers, and the Proposer reacted to this with less advantageously inequitable proposals.