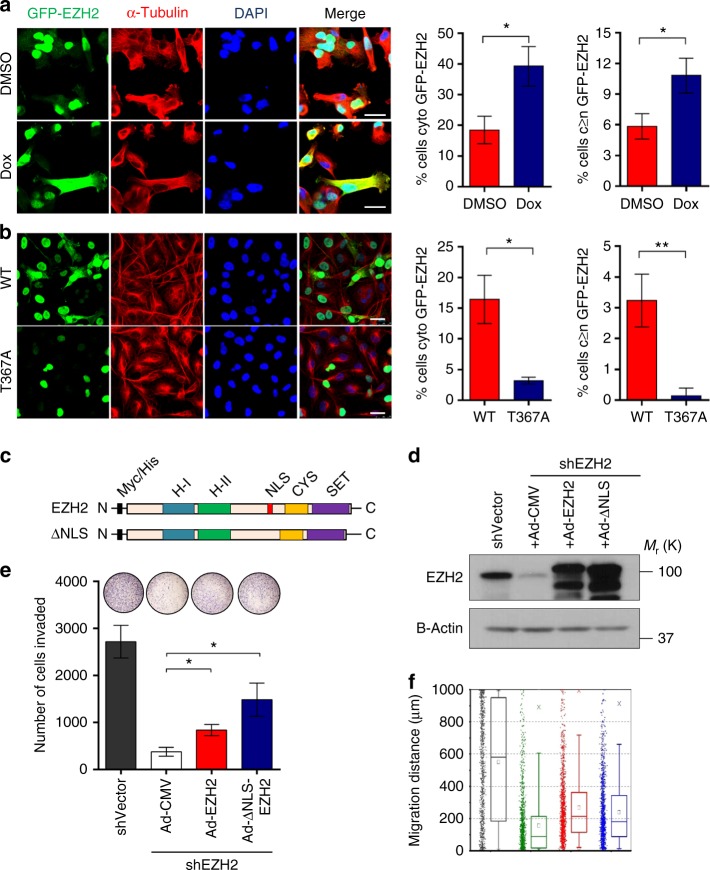
Fig. 3.
p38-mediated phosphorylation at T367 promotes EZH2 cytoplasmic localization and is sufficient for migration and invasion of breast cancer cells. a Immunofluorescence images of MDA-MB-231 cells transduced with lentiviruses to express GFP-EZH2 and a dox-inducible, constitutively active MKK6 kinase (MKK6EE). The percentage of non-mitotic cells expressing cytoplasmic EZH2 and cytoplasmic GFP-EZH2≥nuclear expression was quantified for >50 cells from three fields. Scale bars: 25 μm. b Immunofluorescence images of MDA-MB-231 cells transduced with lentivirus to express GFP-EZH2 wild-type or T367A protein. The percentage of non-mitotic cells expressing cytoplasmic EZH2 was quantified for >50 cells from three fields. Statistical analyses were performed using student’s t-test. Scale bars: 25 μm. Data for a, b shown as mean±SD and are representative from an independent experiment that was repeated with three biological replicates, each with at least three technical replicates. Statistical analyses were performed using student’s t-test. c Schematic diagram of myc-tagged EZH2 and nuclear localization signal (NLS) mutant (top left). d Western blot analysis of MDA-MB-231 cells showing EZH2 knockdown after lentiviral transduction with control shRNA (shVector) or 3′ UTR EZH2-targeting shRNA (shEZH2) and rescue with myc-tagged Ad-EZH2 or Ad-ΔNLS mutant (top right). Ad-CMV, adenovirus control vector. e Cell invasion assay of cells in d using a reconstituted Boyden basement membrane invasion chamber assay. Data are from at least three independent experiments carried out in at least triplicate and are presented as mean±SD. f Cell migration assays were performed in cells described in d using a high-throughput microfluidic migration platform to measure migration distance after 24 h. Data were collected from four replicates (a total of 1200 channels) were performed. Box graphs were plotted using Origin 9.0. The bottom and top of the box are the first and third quartiles, and the band inside the box is always the second quartile (the median). The ends of the whiskers represent the 5th percentile and the 95th percentile. The square inside the box indicates the mean, and the x outside the box indicates the minimum and maximum of all of the data. *p ≤ 0.05; **p ≤ 0.01

