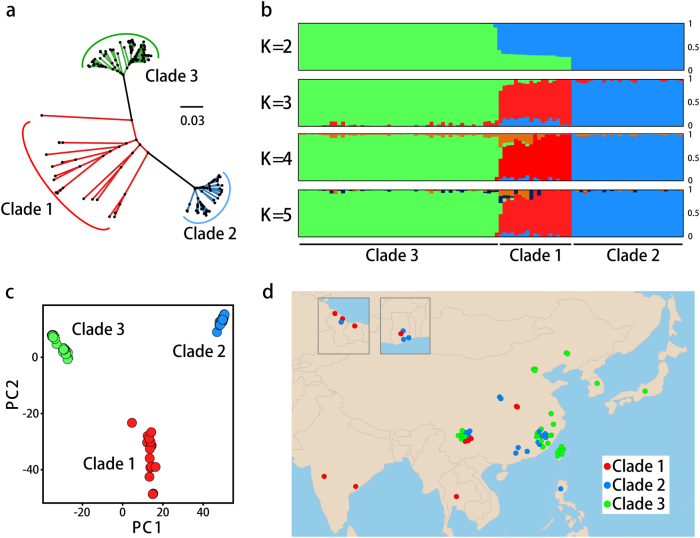
Fig. 1.
Phylogenetic relationship of M. oryzae isolates. a Phylogenomic tree of M. oryzae isolates based on whole-genome SNP data. b STRUCTURE analysis of M. oryzae isolates. Each color in the plots represents the cluster membership coefficients. The presence of several colors in the same strain suggests admixture. c Principal component analysis (PCA) of M. oryzae isolates. d Origin of samples in this study. Red, blue, and green dots represent isolates of clade 1, clade 2 and clade 3. Some dots represent more than one isolate with same collection site. Suriname, French Guiana (left), and Ghana (right) are presented separately in two windows, for more information see Table S1

