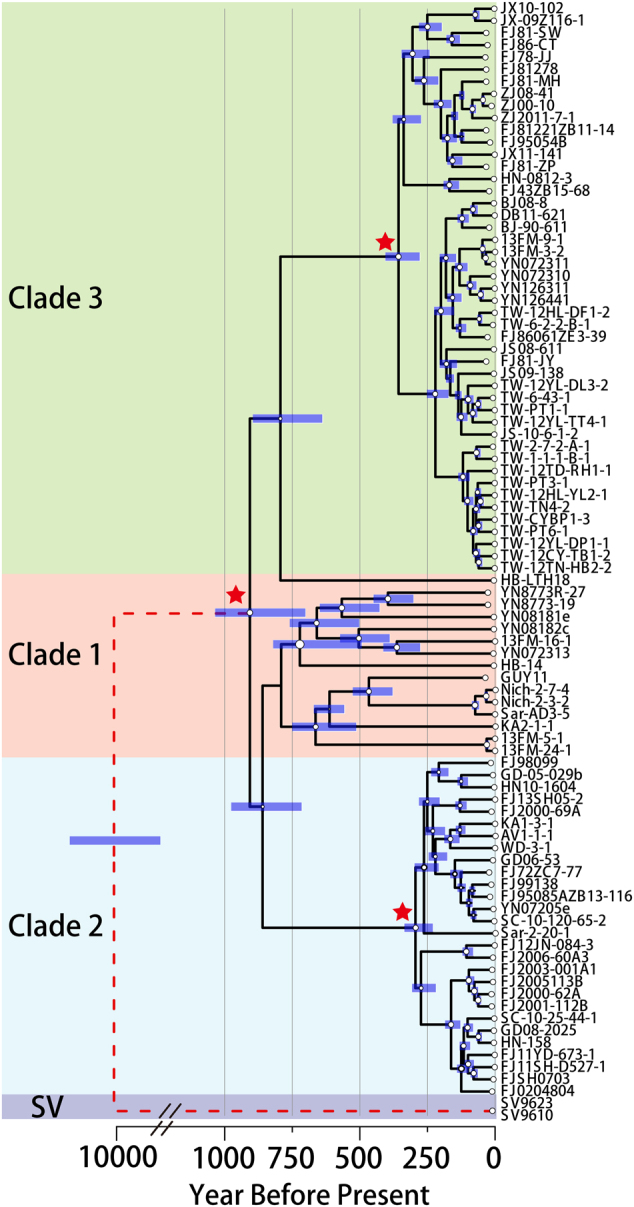
Fig. 2.

Estimation of divergence time of M. oryzae populations. Chronogram from Bayesian phylogenetic analysis on whole-genome SNP dataset. Whole-genome SNP sequences were calibrated by collection dates. Blue bars indicate 95% highest posterior density intervals of node-age estimates. SV represent isolates collected from S. viridis. The red dashed line shows the break in the time axis of SV to rice population branch. Red stars marked divergence (star 2) or expansion (stars 1 and 3) time of clades
